How to use XML tags in Claude prompts
Wrapping parts of your prompt in simple tags is one of the easiest ways to get more reliable answers from Claude. A practical guide with examples.
Give Claude one statistic and its context, and get a short animated visual in HTML that builds the number up step by step instead of just showing it.
I have one number I need people to actually feel, not just see. Build me a short animated visual for it.

The number and its context: [e.g. "our support response time went from 14 hours to 45 minutes after the change"]
Where it'll be shown: [e.g. a slide in an all-hands, a social post, a landing page]
What the audience should take away: [ONE SENTENCE]

What I need:
- A single HTML file, no libraries, that animates over 6 to 8 seconds and then holds on the final state.
- Build the number up: a counter that ticks, bars that grow, or a before and after that reveals in sequence. Pick what fits the story.
- One line of text that states the finding, appearing at the end. State it as a finding ("31 times faster"), not as a topic ("response times").
- Two colours at most: one neutral for "before", one strong for "after".
- It should loop cleanly when it's a social post, and play once when it's a slide. Make that a one line switch at the top of the file.

Keep the numbers exactly as I gave them. Round only in the caption, and say that you did.A before and after animation in one HTML file: the old bar draws first, then the new bar with a counter ticking to the final figure, and the caption fades in on the last beat. A single variable at the top switches between looping and playing once.
NoteThis is an example. Results change between runs and model versions. Claude Prompts is a fan project and is not affiliated with Anthropic.
The all-hands slide with one big result. The launch post. The moment in a pitch where one number carries the argument. A number that arrives over a few seconds gets remembered, and a number that's simply there gets skimmed.
"14 hours to 45 minutes" is a fact. "Customers used to wait overnight, now they get an answer before their coffee's cold" is the story, and the animation is better when the prompt knows which one you're telling. Say where it'll be shown too. A slide can be tall and slow, and a social post has to make its point in the first two seconds.
The animation is persuasion, so the numbers underneath it have to be exact. The prompt tells Claude not to round except in the caption, and to say when it does. Check the final frame against your source. And don't let the bar for "before" get drawn deliberately tiny to make "after" look bigger than it is. People notice, and it costs you the credibility the number was supposed to buy.
Use the copy button above. The full text is included, nothing is cut off.
Everything highlighted in yellow is a placeholder. Swap it for your own topic, audience or data.
If the result helped, press the heart. Votes decide which prompts make the weekly top 10.
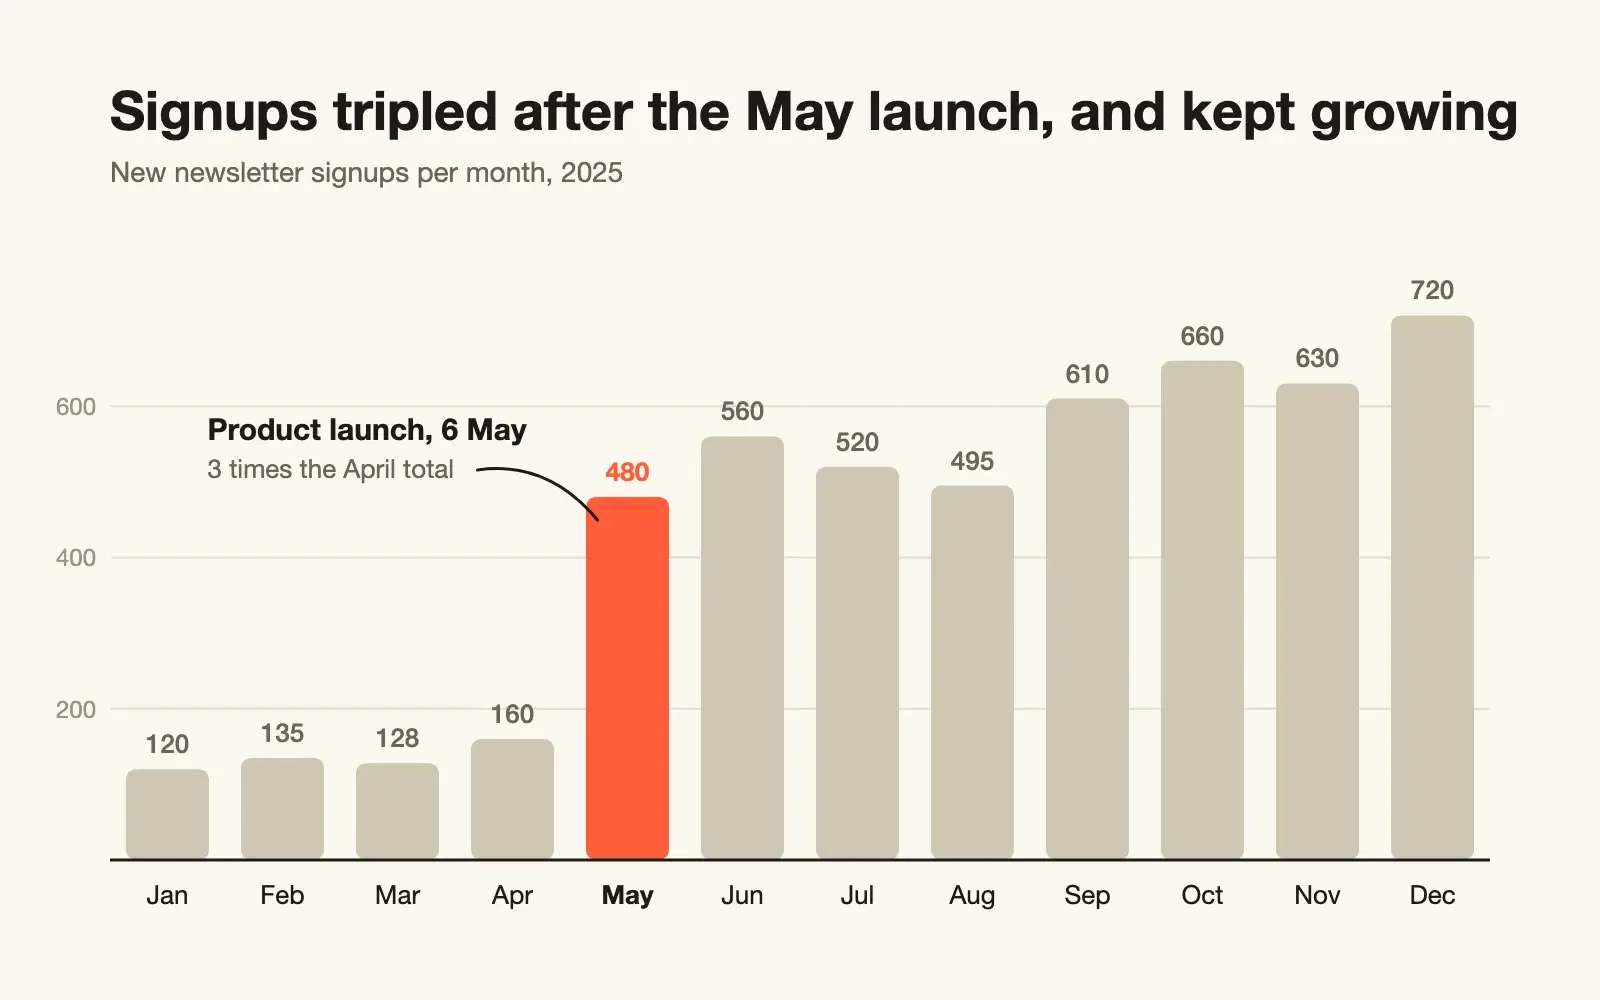
Paste raw CSV and get a clean SVG chart with sensible scales, labels on the data, and a title that says what the chart shows.
1. Correctness Revenue is counted more than once. JOIN orderitems produces one row per item, so SUM(o.total) adds the same order total once for every item in it. An order with three items is tripled. "Today" is the server's...
Have a slow SQL query checked for wrong results first and speed second. You get a rewrite, the indexes to add, and a way to prove it's faster.
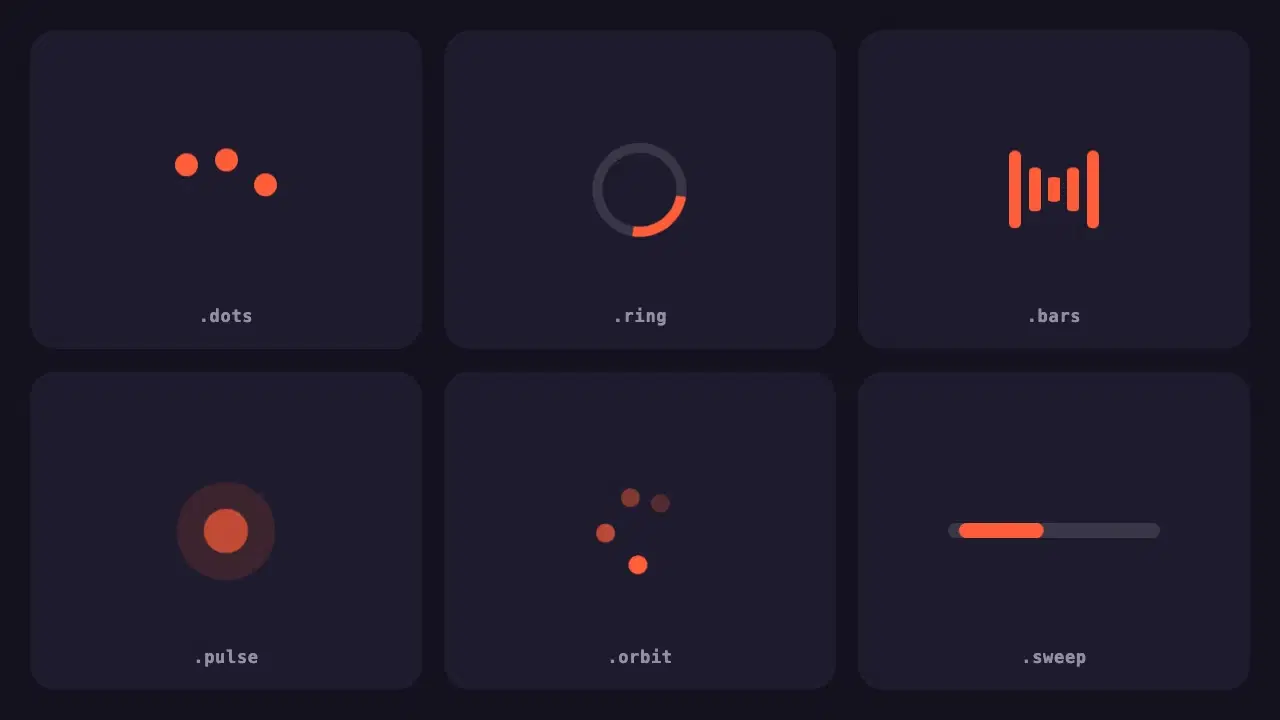
Six lightweight loading indicators in pure CSS. Each has a reduced motion fallback, and one variable changes the colour of all of them.
Wrapping parts of your prompt in simple tags is one of the easiest ways to get more reliable answers from Claude. A practical guide with examples.
None of these cause an error message. They just make every answer a little worse. Here is how to spot each one and what to write instead.