Video output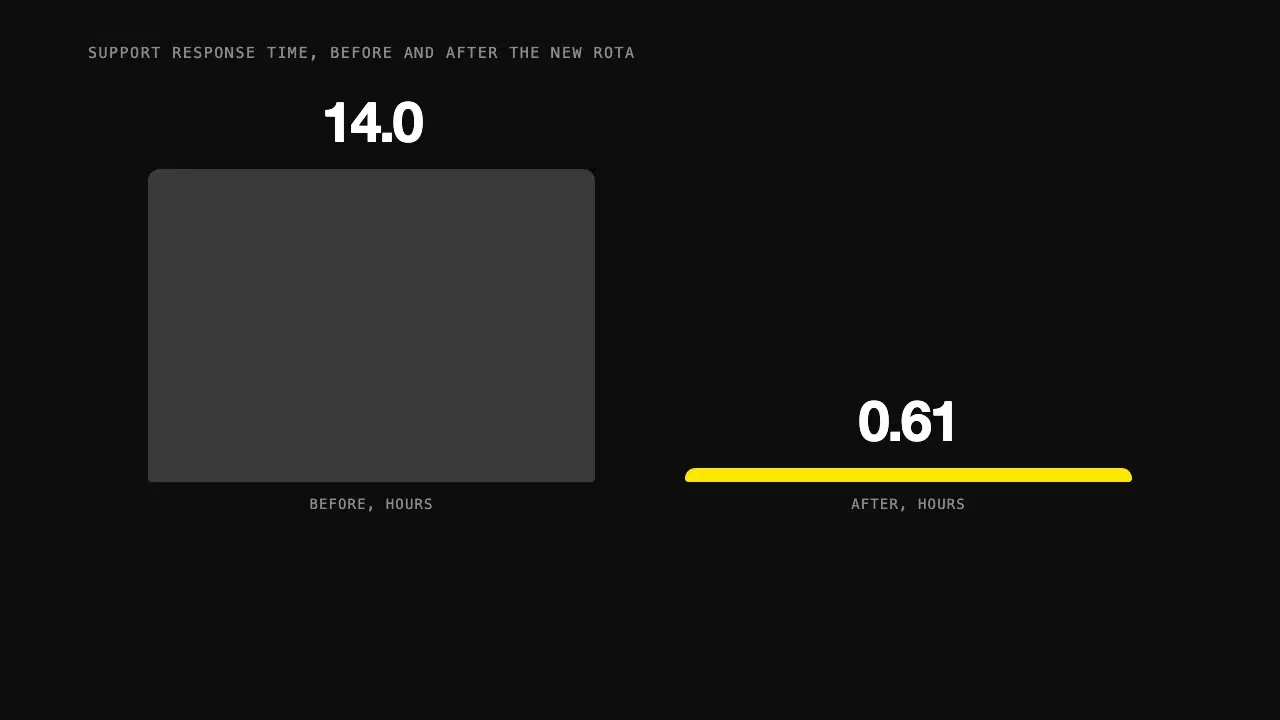
Animate a number so people feel it
Give Claude one statistic and its context, and get a short animated visual in HTML that builds the number up step by step instead of just showing it.
Every data prompt in the collection, most liked first. Each one is free to copy and shows an example of what it produces.
Give Claude one statistic and its context, and get a short animated visual in HTML that builds the number up step by step instead of just showing it.
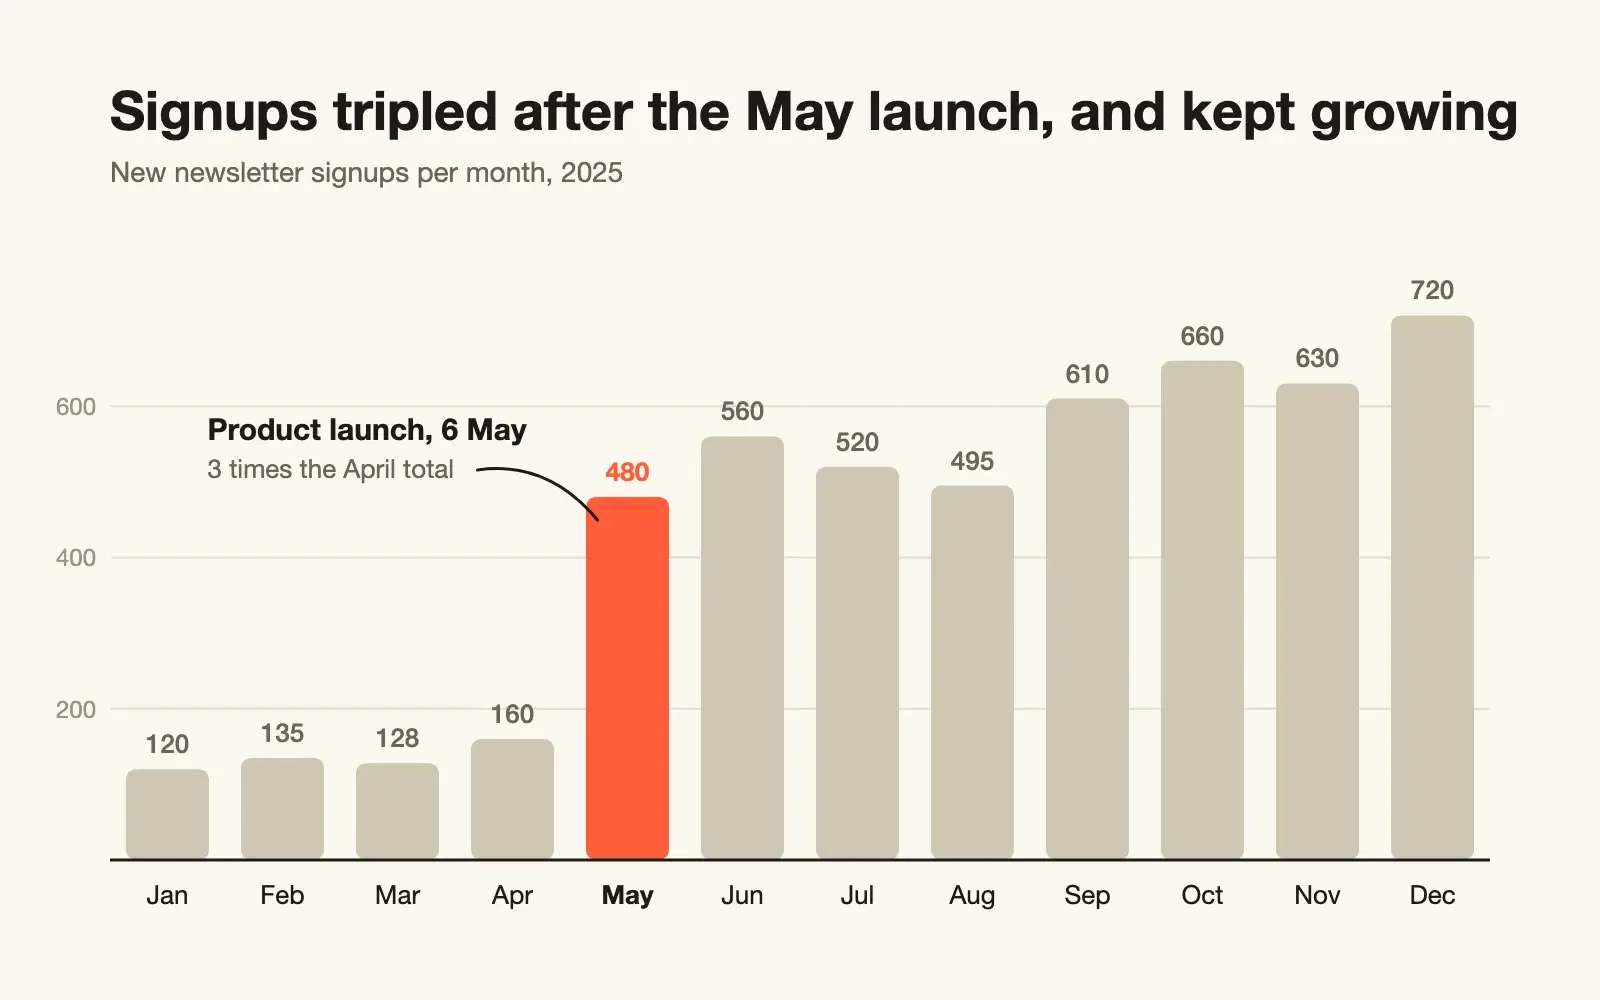
Paste raw CSV and get a clean SVG chart with sensible scales, labels on the data, and a title that says what the chart shows.
1. Correctness Revenue is counted more than once. JOIN orderitems produces one row per item, so SUM(o.total) adds the same order total once for every item in it. An order with three items is tripled. "Today" is the server's...
Have a slow SQL query checked for wrong results first and speed second. You get a rewrite, the indexes to add, and a way to prove it's faster.