The anatomy of a Claude prompt that works the first time
Most disappointing answers come from prompts that are missing one of five parts. Here is what each part does, with a before and after you can copy.
Describe your plans and get a responsive pricing section in one HTML file, with a monthly and yearly toggle, the plan you want people to pick clearly raised, and a feature list that can be compared across cards at a glance.
Build me a pricing section as one HTML file, no frameworks.

Plans, one per line:
[NAME, PRICE PER MONTH, PRICE PER YEAR, WHO IT'S FOR, FEATURES]
The plan I want most people to pick: [NAME]
Brand: [ONE ACCENT COLOUR AS HEX, A FONT IF YOU HAVE ONE, otherwise "your call"]
Currency and locale: [e.g. USD, en-US]

Rules:
- Three cards side by side on desktop, stacked on mobile. The highlighted plan is visibly different (raised, coloured border, a "Most popular" tag) without shouting.
- A monthly and yearly toggle at the top that switches every price without reloading. Show the yearly saving as an amount, not a percentage.
- The same feature order in every card, so a reader can scan across. Features a plan doesn't include are shown greyed out, not left out.
- One button per card, with the same wording on each except the enterprise style plan, which says "Talk to us".
- Prices in large tabular figures so the digits line up. No decimals if every price is a whole number.
- Semantic HTML: the cards are a list, the toggle is a real button with aria-pressed.

No fake testimonials, no "trusted by" logos, no countdown timers.
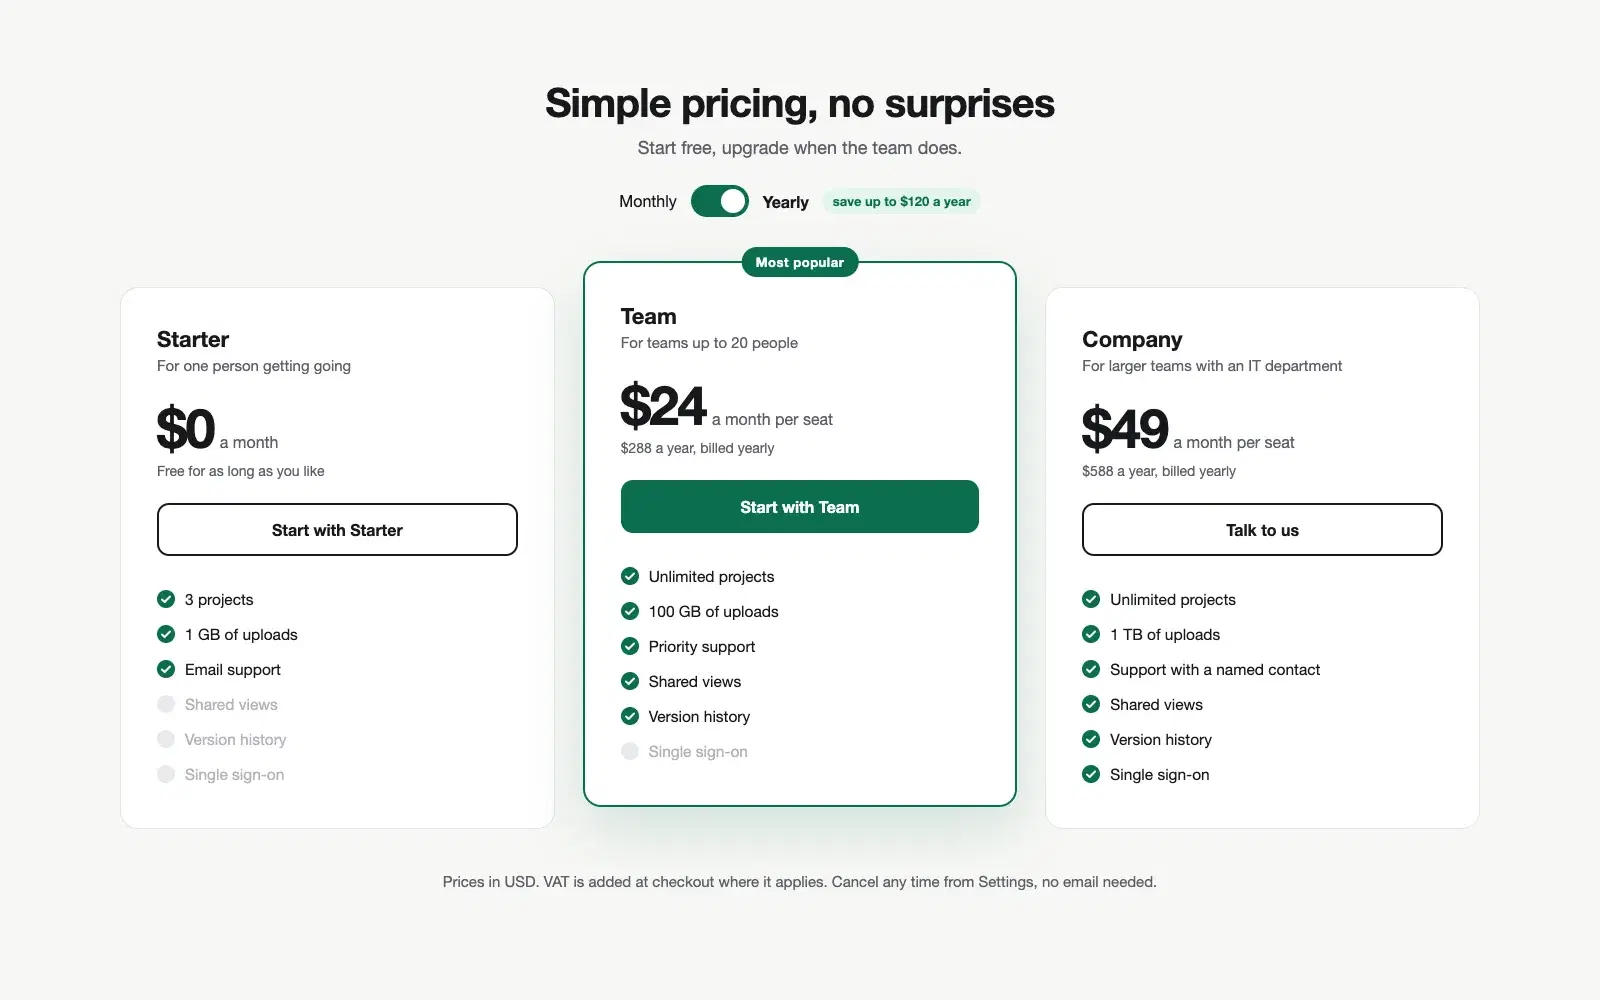
One HTML file: a monthly and yearly toggle, three cards with the middle one raised and tagged, the same six features in the same order on every card with the missing ones greyed out, and the enterprise card ending in "Talk to us".
NoteThis is an example. Results change between runs and model versions. Claude Prompts is a fan project and is not affiliated with Anthropic.
A pricing page with three equal cards asks the visitor to do the comparison themselves, and many of them leave instead. The version this prompt builds has an answer built in: one plan is raised, tagged and slightly larger, and the other two exist to make it look reasonable. Which plan that is depends on your business, so the prompt asks you to name it rather than guessing from the prices.
"Save 20%" makes people do maths. "Save $58 a year" doesn't. The toggle is asked to show the yearly saving as an amount, and to switch every price at once so the page never shows a mix of monthly and yearly figures. If your plans are billed only one way, delete the toggle line from the prompt rather than leaving Claude to invent yearly prices.
When the features are in a different order on each card, nobody can compare them. When they're in the same order with the missing ones greyed out, the eye can run straight across. It's a small rule that does most of the work on the page. It also means an honest list: a feature that's missing is visibly missing, instead of quietly absent.
Use the copy button above. The full text is included, nothing is cut off.
Everything highlighted in yellow is a placeholder. Swap it for your own topic, audience or data.
If the result helped, press the heart. Votes decide which prompts make the weekly top 10.
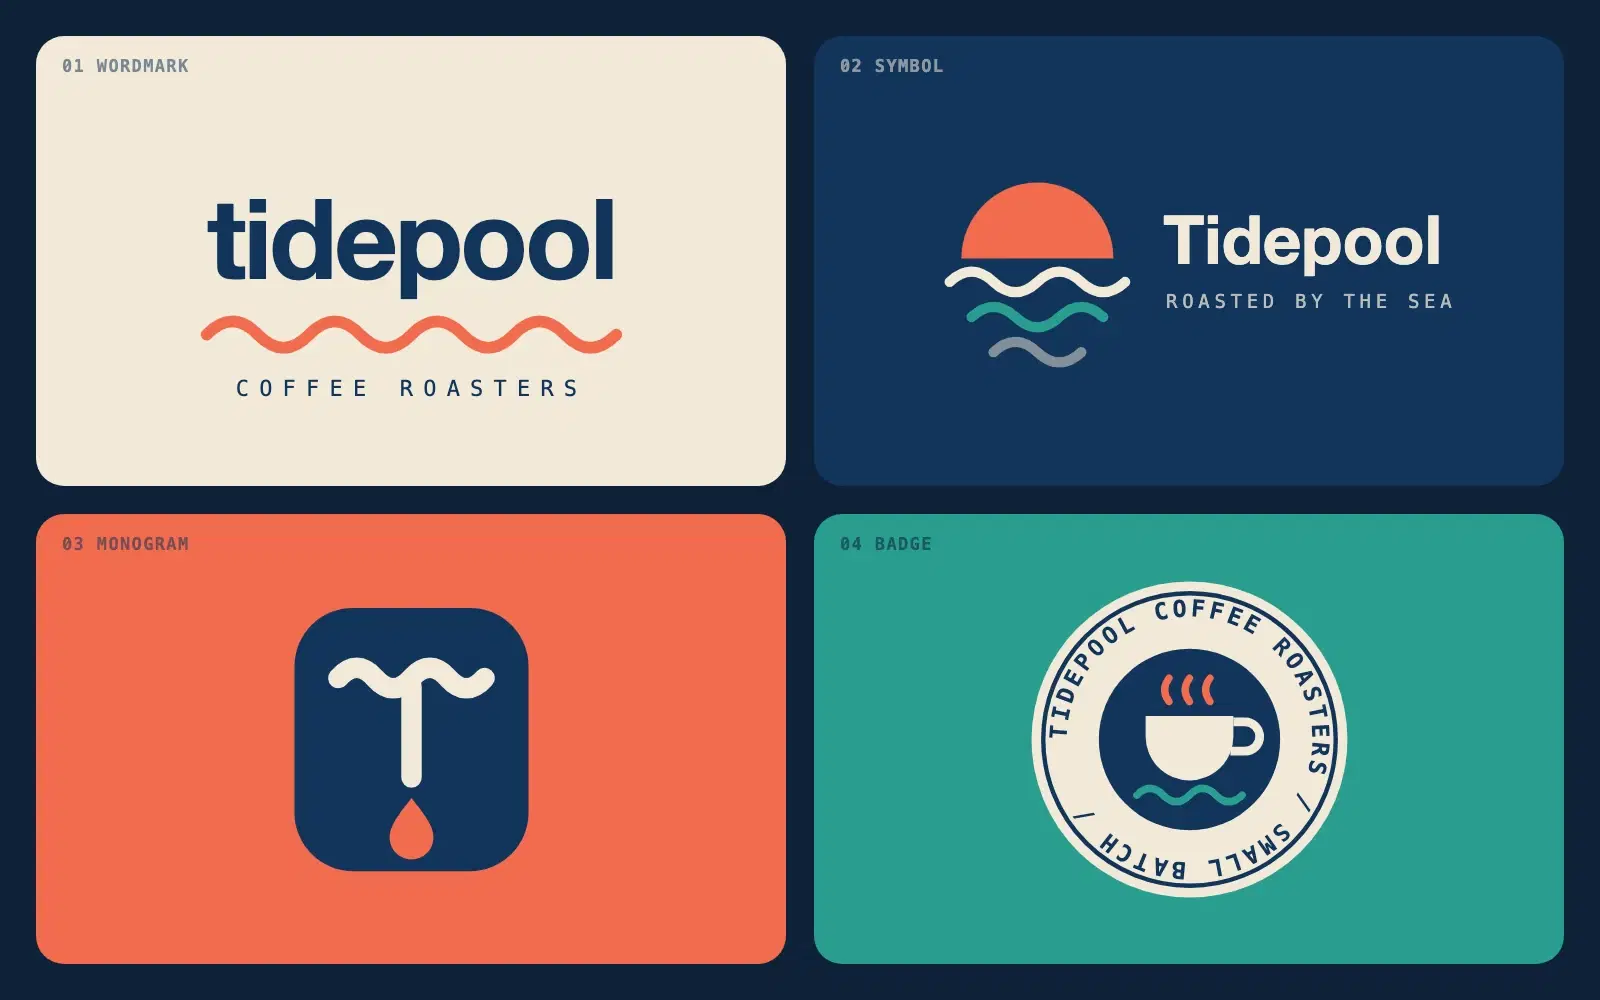
Describe a brand in one sentence and get four different logo directions as clean SVG you can open in a browser or drop into Figma.
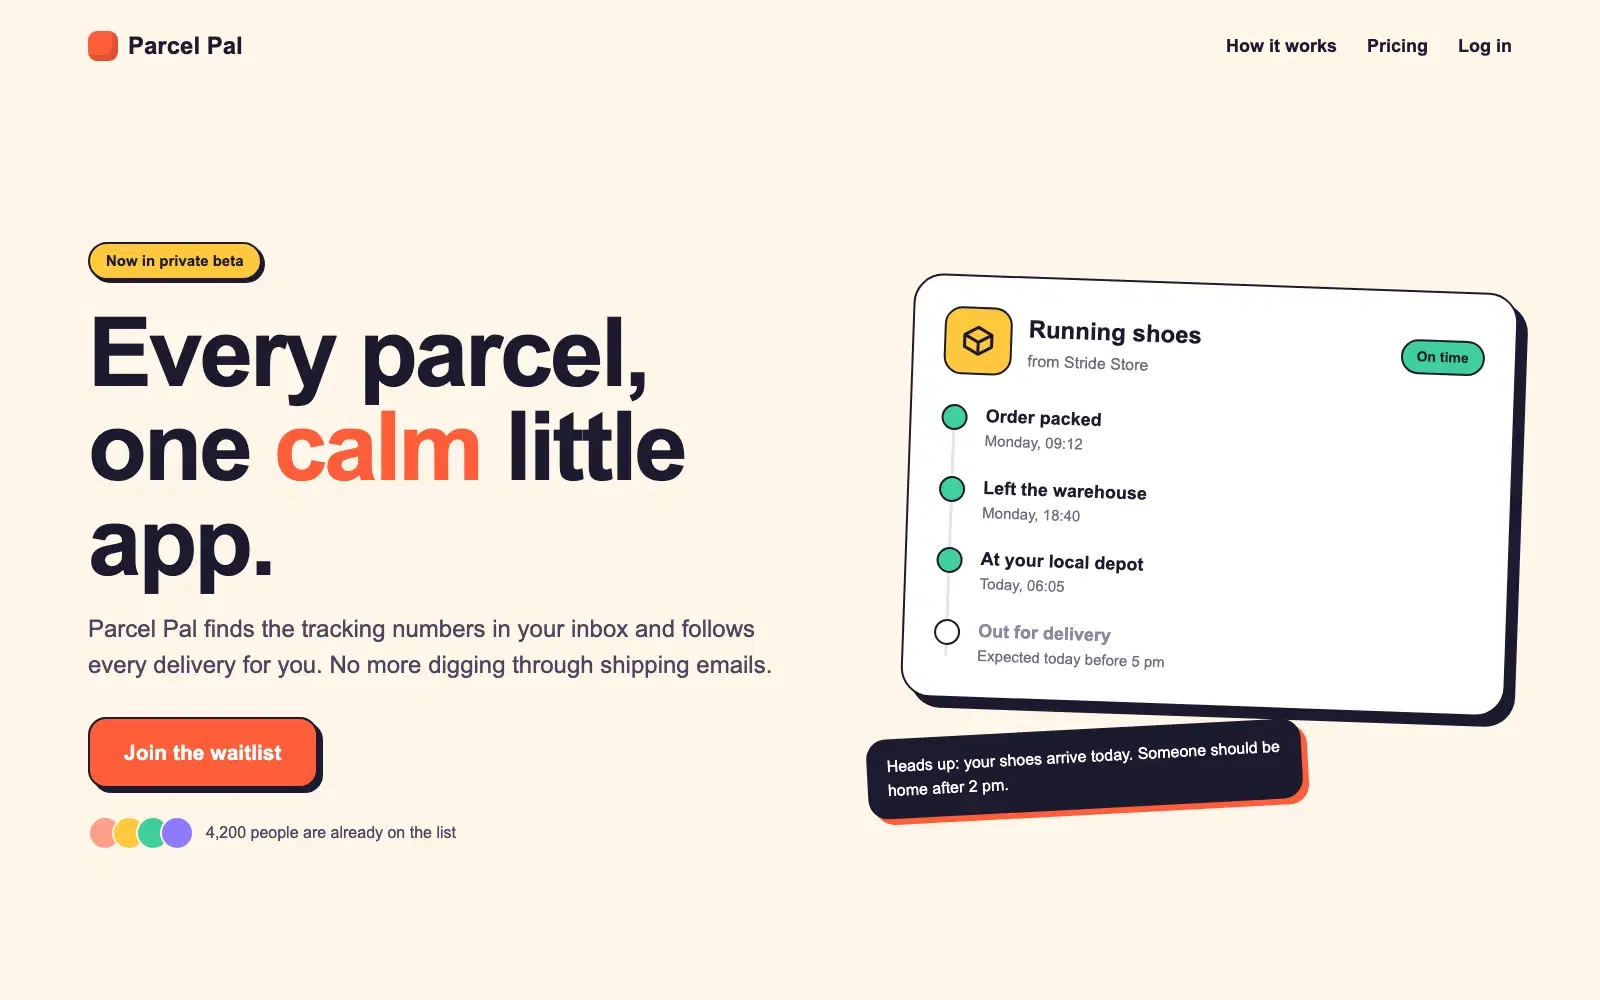
A complete, responsive hero section in a single HTML file. No frameworks, no images, ready to paste into a site or build on.
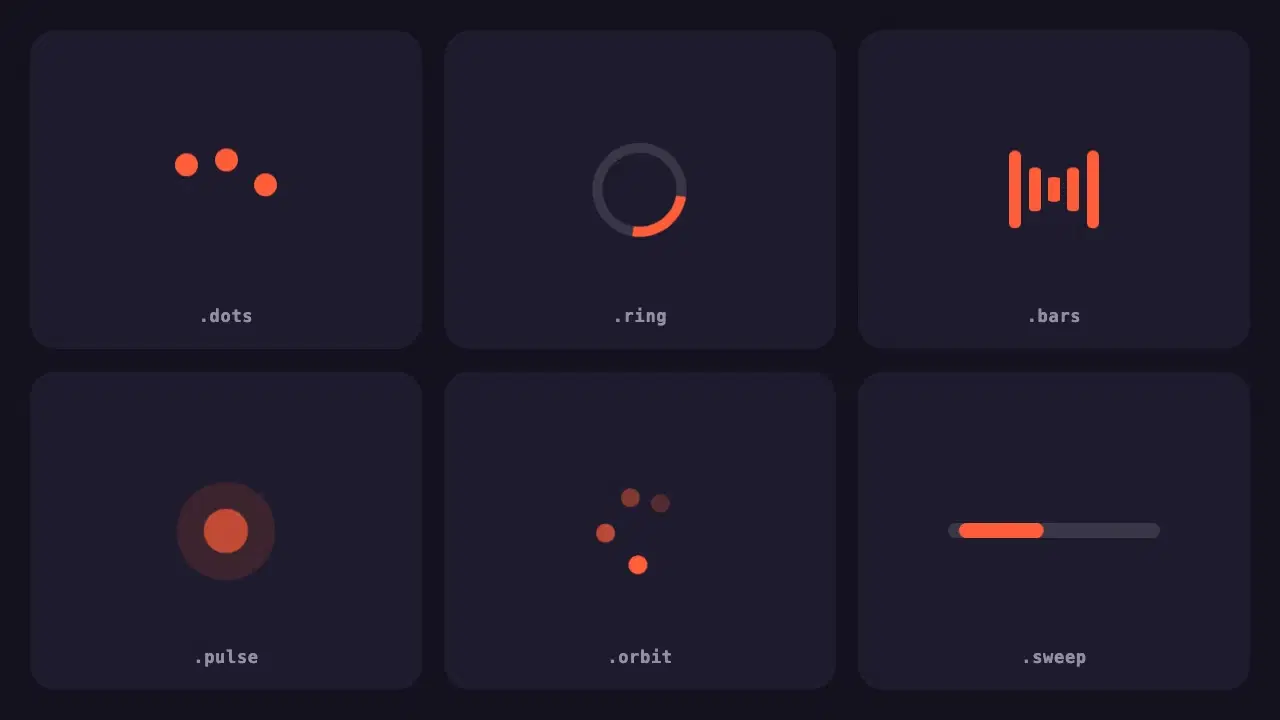
Six lightweight loading indicators in pure CSS. Each has a reduced motion fallback, and one variable changes the colour of all of them.
Most disappointing answers come from prompts that are missing one of five parts. Here is what each part does, with a before and after you can copy.
One vote per prompt, a fresh count every Monday, and a simple tie-break. Everything about how prompts reach the top three, in plain words.